2018 General Election Results
2018 Election Statistics
On the Ballot
Federal and State Offices
- U.S. Senator: 2
- U.S. Representative: 8
- State Senator: 1
- State Representative: 134
- Governor & Lieutenant Governor: 1
- Secretary of State: 1
- State Auditor: 1
- Attorney General: 1
- Supreme Court Chief Justice: 1
- Supreme Court Associate Justices: 3
- Court of Appeals Judges: 6
- District Court Judges: 87
Local Offices
- County Races: 503
- City Races: 1,875
- Township Races: 1,608
- School Board Races: 342
- Hospital District Races: 106
- Soil & Water Conservation District Races: 196
- Park District Races: 2
Ballot Questions
- City Questions: 54
- Township Questions: 31
- School District Questions: 87
Minnesota Jurisdictions by the Numbers
- Congressional Districts: 8
- State Senate Districts: 67
- State Legislative Districts: 134
- Counties: 87
- Cities: 853
- Townships: 1,781
- Counties with Unorganized Territory: 16
- School Districts: 330
- Hospital Districts: 17
- Soil & Water Conservation Districts: 88
- Park Districts: 2
Candidate Filing
Federal and State Candidates
Filed Candidates for Partisan Offices:
- Republican: 172
- Democratic-Farmer-Labor (DFL): 205
- Other: 17
Candidates for Judicial Offices:
- Incumbent only: 89
- Candidates with challengers: 7
- Open seat: 1
Registered Write-ins: 37
Local Candidates
Filed Candidates for:
- County Offices: 806
- City Races: 3,613
- Township Races: 1,571
- School Board Offices: 1,418
- Hospital District Offices: 97
- Soil & Water Conservation Offices: 215
- Park Offices: 3
Races with no candidate filed:
- County Offices: 0
- City Races: 92
- Township Races: 146
- School Board Offices: 2
- Hospital District Offices: 14
- Soil & Water Conservation Offices: 7
- Park Offices: 0
Voter Registration
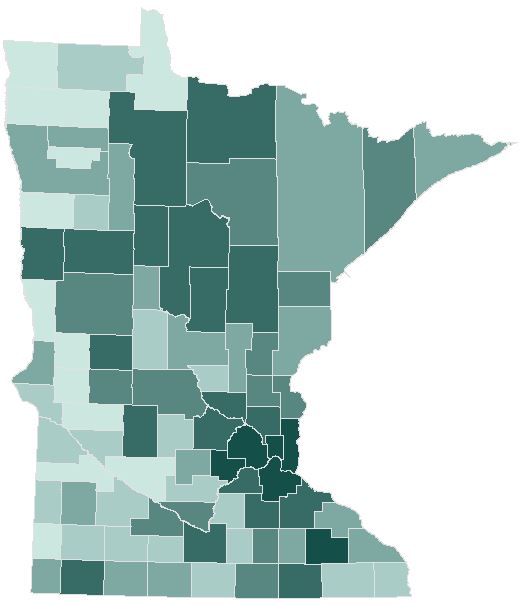
Pre-Registered Voters
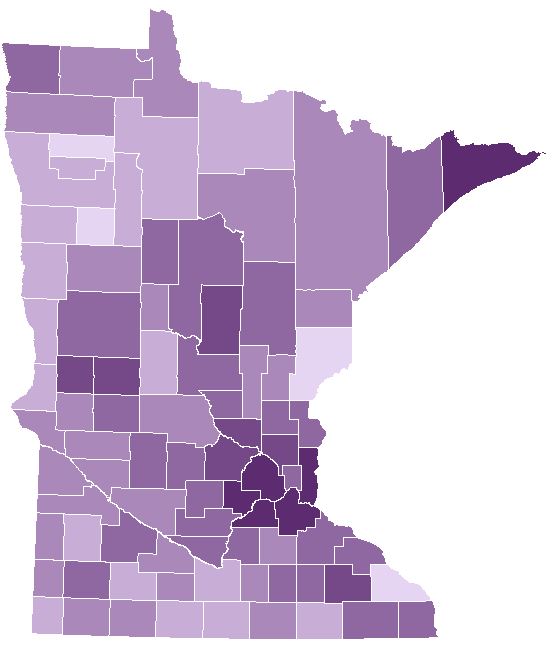
Minnesota voters may pre-register up to three weeks before Election Day. Total voters who pre-registered before the general election was 3,315,627. In the map image below, counties with darker shades had a higher percentage of eligible voters pre-registered. County percentages ranged from 66% to 90%. Click on the image to view a pdf with rates for each county.
| Precinct | County | Registered at 7 am Election Day |
|---|---|---|
| Monticello | Wright | 7112 |
| Saint Michael P-1B | Wright | 6046 |
| Otsego P-1A | Wright | 5366 |
| Wyoming | Chisago | 5110 |
| Rogers P-2 | Hennepin | 4693 |
| Chaska W-2 | Carver | 4560 |
| Saint Michael P-1A | Wright | 4418 |
| Woodbury P-9A | Washington | 4320 |
| Waconia W-2 | Carver | 4306 |
| Champlin W-1 P-1 | Hennepin | 4278 |
Find pre-registered data for all precincts in the 2018 Precinct Results Spreadsheet
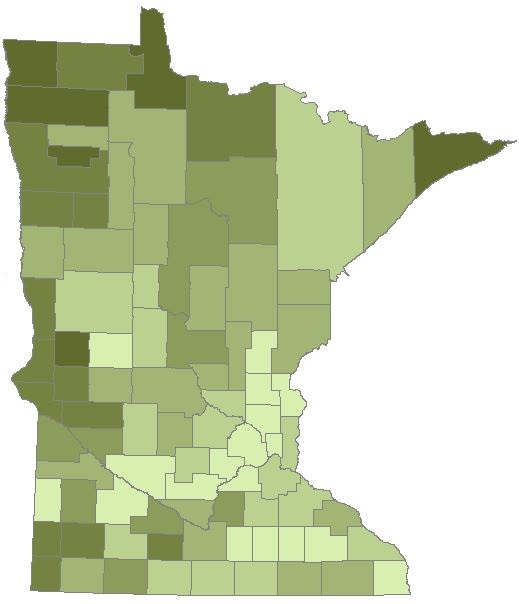
Election Day Registration
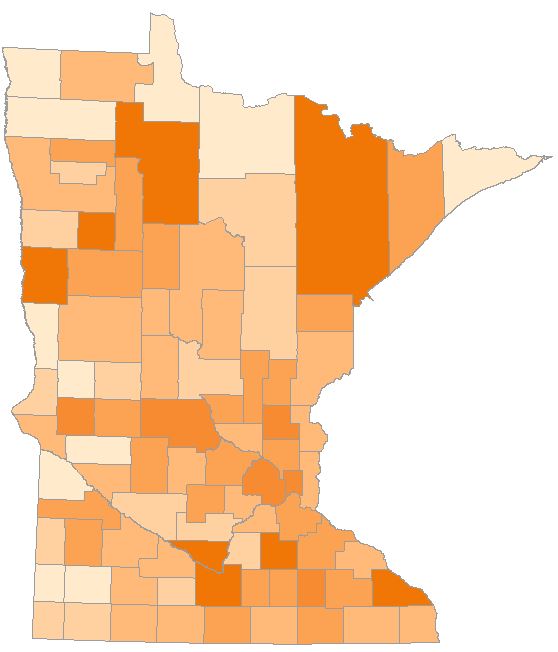
Minnesota voters may register when they vote. 213,999 voters registered when they voted in the general election. Note that these might be new voters, or voters re-registering after changing their name or address. In the map image below, counties with darker shades had a higher percentage of voters that registered when voting. County percentages ranged from 3.1% to 12.5%. Click on the image to view a pdf with rates for each county.
| Precinct | County | Election Day Registrations |
|---|---|---|
| Minneapolis W-3 P-1 | Hennepin | 1259 |
| Duluth P-10 | St. Louis | 968 |
| Saint Paul W-4 P-6 | Ramsey | 659 |
| Northfield W-4 P-2 | Rice | 637 |
| Minneapolis W-10 P-2 | Hennepin | 635 |
| Minneapolis W-2 P-10 | Hennepin | 627 |
| Minneapolis W-2 P-4 | Hennepin | 595 |
| Saint Joseph P-1 | Stearns | 593 |
| Minneapolis W-3 P-2 | hennepin | 565 |
| Duluth P-11 | St. Louis | 543 |
Find election day registration data for all precincts in the 2018 Precinct Results Spreadsheet
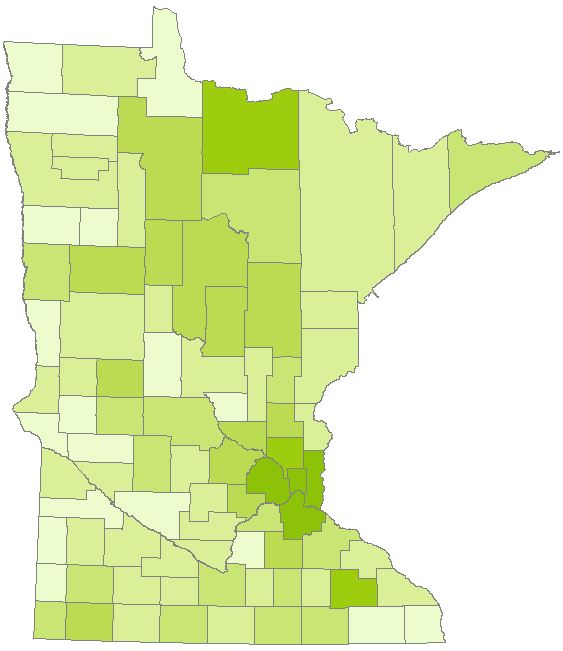
Voter Turnout
Total Turnout
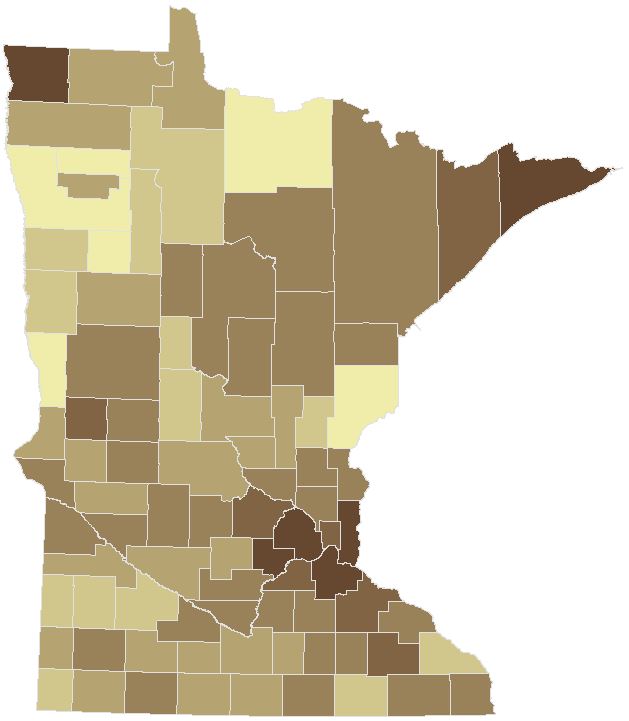
Voter turnout is the number of voters divided by the number of eligible voters. The total number of voters in the 2018 general election was 2,611,365. This office does not have exact eligible voter data, so uses statewide data from the United States Election Project on election night. Citizen Voting Age Population (CVAP) data from the U.S. Census is less exact, but available by county. In the map image below, counties with darker shades had higher turnout. County percentages ranged from 50% to 76%. Click on the image to view a pdf with rates for each county.
| Precinct | County | Total Votes Cast |
|---|---|---|
| Monticello | Wright | 4840 |
| Saint Michael P-1B | Wright | 4619 |
| Wyoming | Chisago | 4075 |
| Otsego P-1A | Wright | 3896 |
| Rogers P-2 | Hennepin | 3786 |
| Chaska W-2 | Carver | 3657 |
| Waconia W-2 | Carver | 3482 |
| Woodbury P-9A | Washington | 3442 |
| Shoreview P-5 | Ramsey | 3418 |
| Plymouth W-1 P-2 | Hennepin | 3306 |
Find polling place voting data for all precincts in the 2018 Precinct Results Spreadsheet
Polling Place Voting
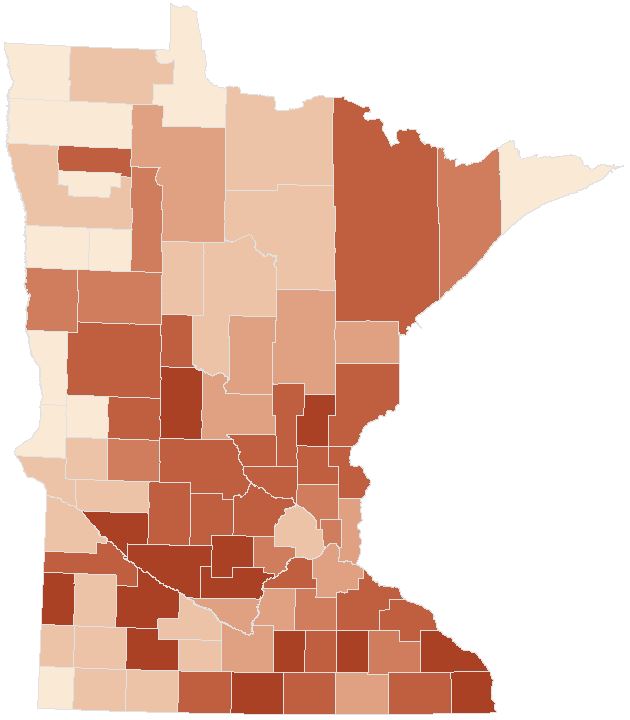
Most Minnesota voters vote at their polling place on Election Day. In 2018, about 1.97 million voters voted at a polling place. In the map image below, counties with darker shades had a higher percentage of votes cast in polling places. County percentages ranged from 16.6% to 90.7%. Click on the image to view a pdf with rates for each county.
| Precinct | County | Votes Cast in Polling Place |
|---|---|---|
| Monticello | Wright | 3622 |
| Wyoming | Chisago | 3427 |
| Otsego P-1A | Wright | 3278 |
| Saint Michael P-1B | Wright | 3207 |
| Otsego P-2A | Wright | 2671 |
| Chaska W-2 | Carver | 2625 |
| Belle Plaine | Scott | 2510 |
| Saint Michael P-1A | Wright | 2484 |
| Waconia W-2 | Carver | 2461 |
| Stewartville | Olmsted | 2452 |
Find polling place voting data for all precincts in the 2018 Precinct Results Spreadsheet
Absentee Voting
Voters throughout Minnesota may vote early as absentees without excuse, in person or by mail. The total number of accepted absentee ballots was about 561 thousand for the 2018 general election. In the map image below, counties with darker shades had a higher percentage of votes cast by absentee voting. County percentages range from 6.5% to 28.9%. Click on the image to view a pdf with rates for each county.
| Precinct | County | Absentee Ballot Votes |
|---|---|---|
| Rogers P-2 | Hennepin | 1418 |
| St Michael P-1B | Wright | 1411 |
| Plymouth W-1 P-2 | Hennepin | 1396 |
| Wayzata P-1 | Hennepin | 1278 |
| Plymouth W-2 P-7 | Hennepin | 1232 |
| Plymouth W-3 P-14 | Hennepin | 1229 |
| Monticello | Wright | 1219 |
| Shoreview P-3 | Ramsey | 1207 |
| Champlin W-1 P-1 | Hennepin | 1178 |
| Plymouth W-1 P-5 | Hennepin | 1144 |
Find absentee voting data for all precincts in the 2018 Precinct Results Spreadsheet
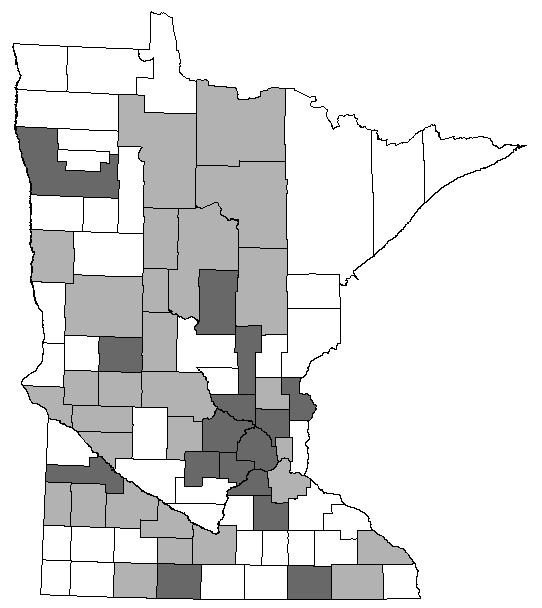
Mail Voting
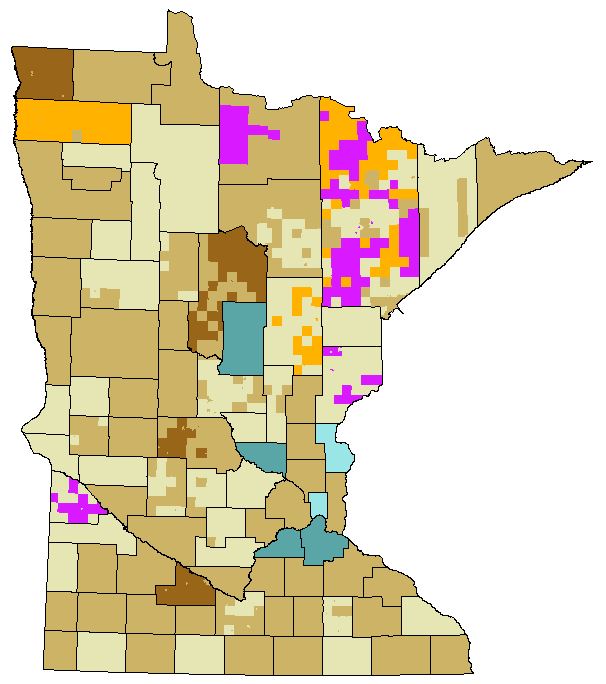
Some areas in Minnesota are designated to vote by "mail ballot" which means that ballots are mailed to registered voters and voters do not go to a normal polling place on Election Day. About 77 thousand voters voted this way for the 2018 general election. In the map image below, counties with darker shades had a higher percentage of votes cast by mail voting. Eighteen counties had no mail balloting, and other counties had up to 71.4% of voting by mail ballot. Click on the image to view a pdf with rates for each county.
| Precinct | County | Mail Ballot Votes |
|---|---|---|
| Bass Lake | Itasca | 619 |
| Sugar Lake | Itasca | 614 |
| Kasota Twp P-2 | Le Sueur | 579 |
| Belgrade Twp | Nicollet | 492 |
| Washington Twp | Le Sueur | 485 |
| Langola Twp | Benton | 473 |
| Cottonwood Twp | Brown | 447 |
| Maple Hill P-8A | Cook | 389 |
| Munson Twp P-2 | Stearns | 385 |
| Deer Lake | Itasca | 369 |
Find which precincts voted by mail ballot in the 2018 Precinct Results Spreadsheet
Early Voting
Voters throughout Minnesota may vote before election day as absentees without excuse, in person or by mail. Voting absentee in person at a county or city location is sometimes called "early voting." About 340 thousand voters completed their absentee ballots in person before Election Day. In the map image below, counties with darker shades had a higher percentage of votes cast via early voting. County percentages range from 3% to 18.3%. Note that these "early votes" are also counted in the absentee voting counts above. Click on the image to view a pdf with rates for each county.
| Precinct | County | Early Votes |
|---|---|---|
| St Michael P-1B | Wright | 1103 |
| Rogers P-2 | Hennepin | 1061 |
| Forest Lake P-5 | Washington | 937 |
| Wayzata P-1 | Hennepin | 930 |
| Shoreview P-3 | Ramsey | 923 |
| Plymouth W-1 P-2 | Hennepin | 902 |
| Plymouth W-2 P-7 | Hennepin | 896 |
| Monticello | Wright | 895 |
| Plymouth W-3 P-14 | Hennepin | 864 |
| Shoreview P-5 | Ramsey | 845 |
Precincts and Polling Places
By the Numbers
- Precincts: 4,113
- Mail Ballot Precincts: 938
- Cities with multiple precincts: 210
- Towns with multiple precincts: 43
- Municipalities offering absentee voting: 126
- Election Judges on Election Day (as reported by counties): 28,702
ePollbook Usage
Some counties have purchased electronic pollbooks to replace paper rosters in some or all of their precincts. Click on the image to view a pdf with more information about voting equipment used in 2018.
- ePollbooks used in entire county: 16
- ePollbooks used in part of county: 29
- ePollbooks not used in county: 42
Vote Tabulation Equipment
The table below shows the model of equipment that was used for tabulating votes, including votes from polling places, absentee ballots, and mail ballots. Data as reported by Minnesota counties. Click on the image to view a pdf with more information about voting equipment used in 2018.
| Equipment Model | Number Used |
|---|---|
| ES&S Digital Scan 200 | 1,840 |
| ES&S Model 100 | 644 |
| Dominion ImageCast Evolution | 284 |
| Hart Verity Scan | 207 |
| Dominion ImageCast Central | 17 |
| ES&S Digital Scan 850 | 15 |
| ES&S Digital Scan 450 | 10 |
| Hart Verity Central | 4 |
| Hand Count | 73 |